Trying out Domino data services with Chart.js
Domino Data Access Services have been around for a few years now, but I never actually used them myself.
Since I recently started to dabble in Ethereum mining, I was looking for a place to store my data and draw some graphs and the likes. I first tried out LibreOffice Calc, but I couldn’t find an easy way to automatically update it with data from a REST API.
So I turned to good old Domino, being the grandpa of NoSQL databases (before it was cool).
The solution I came up with, retrieves multiple JSON streams from various sources, combines it into a single JSON , that is then uploaded into a Domino database (using Python).
To look at the data, I created a literal “SPA” (single page application) - I use a Page in Domino to run Javascript code , to retrieve the data , again in JSON format, and turn it into a nice graph (using charts.js) .
So I don’t actually use any Domino code to display anything, Domino is simply used to store and manage the data.
This article consists of 2 parts :
-
loading of data into Domino using Python and REST services.
-
displaying data from Domino using the Domino Data Access Services and an open-source javascript library to display charts ( http://www.chartjs.org/ )
Python to Domino
Domino preparation
To use the Domino Data Access services in a database, you need to enable them
- On the server
- In the Database properties (Allow Domino Data Service)
- In the View properties
Server configuration
Open the internet site document for the server/site you are interested in.
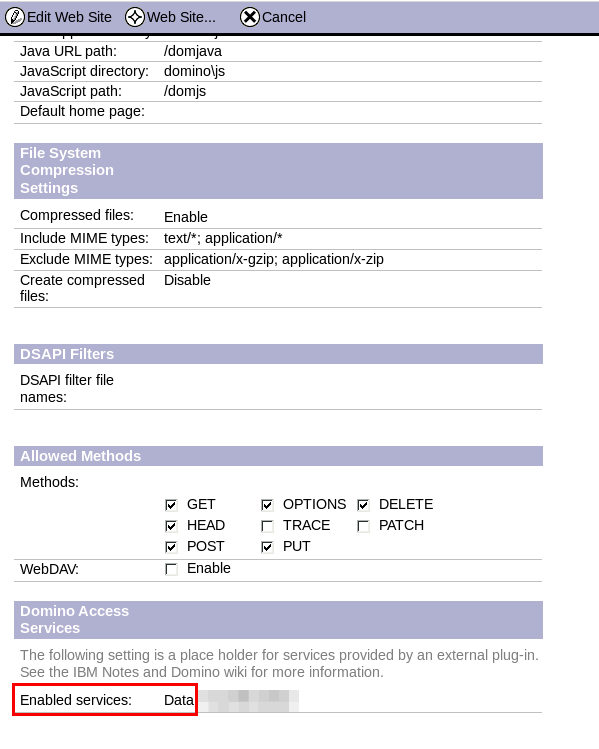
In the Configuration tab, scroll down to the “Domino Acces Services” . Enable “Data” here.
Note that you may want to verify the enabled methods as well - enable PUT if you plan to use the services that use PUT requests.
And if you’re not use Internet Site documents yet, well, then I can’t help you :-)
After modifying the Internet Site document, you need to restart the HTTP task on your Domino server.

Database properties
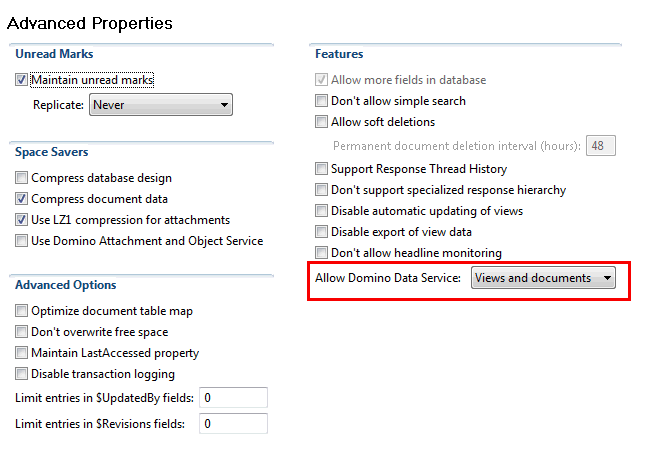
In the Advanced properties, select “Views and Documents” for the “Allow Domino Data Service” option.

View properties
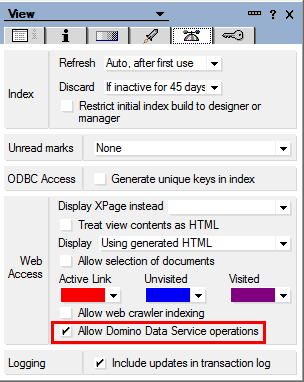
Open the View properties. and on the second to last tab, enable “Allow Domino Data Service operations”.

There is no equivalent option in Forms.
Python code
Instead of figuring out how to load JSON data in a Notes agent or Xpages (which no doubt is possible, but seems a lot of work), I choose to use a simple Python script, that I kick of using a cron job. I run this code collocated with the Domino server, but that is not necessary . Because the POST requires authentication, and the url used it using TLS, this could just as well run anywhere else.
Any other server-side code would do the same thing , so Node.js or Perl or … are all valid options.
There’s 2 JSON objects retrieved:
resultseth = requests.get('http://dwarfpool.com/eth/api?wallet={wallet}&email={email address}')
data = resultseth.json()
and
currentprice = requests.get('https://min-api.cryptocompare.com/data/price?fsym=ETH&tsyms=BTC,USD,EUR')
pricedata = currentprice.json()
The first JSON that’s returned , contains nested data (the workers object) .
{
“autopayout_from”: “1.0”,
“earning_24_hours”: “0.1123”,
“error”: false,
“immature_earning”: 0.000890178102,
“last_payment_amount”: “1.0”,
“last_payment_date”: “Thu, 16 Nov 2017 16:24:01 GMT”,
“last_share_date”: “Mon, 04 Dec 2017 12:41:33 GMT”,
“payout_daily”: true,
“payout_request”: false,
“total_hashrate”: 30,
“total_hashrate_calculated”: 31,
“transferring_to_balance”: 0.0155,
“wallet”: “0x5ac81ec3457a71dda2af0e15688d04da9a98df3c”,
“wallet_balance”: “5411”,
“workers”: {
“worker1”: {
“alive”: true,
“hashrate”: 15,
“hashrate_below_threshold”: false,
“hashrate_calculated”: 16,
“last_submit”: “Mon, 04 Dec 2017 12:38:42 GMT”,
“second_since_submit”: 587,
“worker”: “worker1”
},
“worker2”: {
“alive”: true,
“hashrate”: 15,
“hashrate_below_threshold”: false,
“hashrate_calculated”: 16,
“last_submit”: “Mon, 04 Dec 2017 11:38:42 GMT”,
“second_since_submit”: 111,
“worker”: “worker2”
}
}
}
It turns out that Domino does not like that very much or rather cannot handle nested JSON, but there is a simple solution - flatten the JSON.
This uses the flatten_json class in Python, so it easy to use.
In the sample above, it would translate
{ "workers":
{ "worker1":
 "worker": "worker1"
}
}
into
{workers_worker1_worker: "worker1"}
(Information about this particular API , is here http://dwarfpool.com/api/ )
The flatten_json, can be installed using pip
pip install flatten_json
I can get the current price of ETH expressed in EUR, dollars and Bitcoin, from a public API.
In Python, I now have 2 dictionary objects , with the JSON data (key - value pairs)
I combine them into a a single one, by adding the data of the 2nd dictionary to the first.
for lines in pricedata:
 data[lines] = pricedata[lines]
The nice thing about these Python classes, is that it allows to dynamically edit the JSON before submitting it again. I could remove the data I don’t want, for instance.
In this case, I need to do something about the boolean values that get returned by the Dwarfpool API, because Domino Data Access Services does not like them!
for lines in data:
 print lines,data[lines]
 if data[lines] == True:
     data[lines] = "True"
 if data[lines] == False:
     data[lines] = "False"
The next step is to post the JSON file to Domino.
It’s very straightforward : The url used will create a new Notes document, based on the Form named “Data” . ( https://www-10.lotus.com/ldd/ddwiki.nsf/xpAPIViewer.xsp?lookupName=IBM+Domino+Access+Services+9.0.1#action=openDocument&res_title=Document_Collection_POST_dds10&content=apicontent )
The Domino Form needs to exist of course, but it’s not very important that the fields are on there .
url = 'https://www.gwbasics.be/dev/dataservices.nsf/api/data/documents?form=Data'
There’s some headers to set, in particular Content-Type must be set , to application/json.
To Authenticate, I use a Basic Authentication header . In this case, the user I authenticate with , only has Depositor access to the Database (which is the first time in 20 years of Domino experience, I see the point in having this role in an ACL :-) )
The service responds with an HTTP Code 201, if everything went correctly . This is of course something you can work with (if the response code does not match 201, do something to notify the administrator, for instance) .
The full script:
# retrieves dwarfpool data for my wallet
# retrieves current price ETH
# merges the 2 in a flattened JSON
# uploads the JSON into a Domino database using the domino rest api
import requests
import json
from flatten_json import flatten

resultseth = requests.get('http://dwarfpool.com/eth/api?wallet=<wallet>&email=<email address>')
data = resultseth.json()
print "-----------------"

# retrieve eth price
currentprice = requests.get('https://min-api.cryptocompare.com/data/price?fsym=ETH&tsyms=BTC,USD,EUR')
pricedata = currentprice.json()

print "------------------"
data = flatten(data)

# merge json data
for lines in pricedata:
 data[lines] = pricedata[lines]

for lines in data:
 print lines,data[lines]
 if data[lines] == True:
     data[lines] = "True"
 if data[lines] == False:
     data[lines] = "False"

url = 'https://www.gwbasics.be/dev/dataservices.nsf/api/data/documents?form=Data'
myheaders = {'Content-Type': 'application/json'}
authentication = ("<Depositor userid>", "<password>")
response = requests.post(url, data=json.dumps(data), headers=myheaders, auth=authentication)
print response.status_code
Lessons learned
- The Domino DAS are fast and easy to use , from Python .
- The Domino Data Access Services POST requests do not handle nested JSON, so you need to first massage your JSON into a flat format .
- The Domino DAS is pretty picky about the types - it does not support Boolean values (true/false)
- Finally, I have seen a good use of the Depositor role in action !
Chart.js and Domino
Now the data is in Domino, and we can start thinking about the single page application.
The Single Page Application
I created a Page in Domino, and put all HTML and Javascript on that page as pass-tru HTML.
Having the code in Domino has the advantage that the Domino security model is used. So I need to authenticate first , to be able to use the SPA.
The same code can live anywhere else (eg. as a html page on any webserver), but then I’d have to worry about authenticating the Ajax calls that retrieve the data.
I set the Page to be the “Homepage” of the Database .
I use several javascript libraries, Jquery and Chart.js.
For Chart.js, there’s several ways to include the code, I chose to use a Content Delivery Network ( http://www.chartjs.org/docs/latest/getting-started/installation.html )
<script src="[https://cdnjs.cloudflare.com/ajax/libs/Chart.js/2.7.1/Chart.bundle.js](https://cdnjs.cloudflare.com/ajax/libs/Chart.js/2.7.1/Chart.bundle.js)" integrity="sha256-vyehT44mCOPZg7SbqfOZ0HNYXjPKgBCaqxBkW3lh6bg=" crossorigin="anonymous"></script>
For Jquery, I learned that the “slim” version does not have the JSON libraries, so use the minimized or full version.
Chart.js
Chart.js is a simple charting engine, that is easy to use and apparently also very commonly used.
I did have problems getting it to work correctly with my Domino Data, but that turned out to be related to Domino, not to Chart.js.
The samples that are out there for Chart.js generally do not include dynamic data, so here’s how to use dynamic data from Chart.js using Domino.
Initialize
What worked best for me, is to initialize the Chart in the $.document.ready function. Without Jquery, you can do the same with window.onload .
The chart is stored in a global variable, myChart, so it is accessible from everywhere.
The trick here, is to initialize the Chart’s data and labels as empty arrays. The arrays will be loaded with data in the next step (the title is also dynamic, you may notice).
In this sample, I have 2 datasets, and only at the end of this function, I call the first load of the data (updateChartData)
<script language="JavaScript" type="text/javascript">
var pageNumber = 0;
var pageSize = 24;
var myChart = {};
// prepare chart with an empty array for data within the datasets
// 2 datasets, 1 for EUR , 1 for ETH
$(document).ready(function() {
 // remove data button needs to be disabled when we start .
 document.getElementById('removeData').disabled = true;
 var ctx = document.getElementById("canvas").getContext("2d");
 myChart = new Chart(ctx, {
 type: 'line',
 data:{
         labels: [],
         datasets: [
                      {
                         label: "EURO",
                     data: [],
                     borderColor: '#ff6384',
                     yAxisID: "y-axis-eur"
         &nbs p;              },
                 {
                     label: "ETH",
                     data: [],
                     borderColor: '#36a2eb',
                     yAxisID: "y-axis-eth"
                 }
                     ]
     },
 options: {
         responsive: true,
         animation: {     easing: 'easeInOutCubic',
                 duration: 200,
             },
         tooltips: {
                       mode: 'index',
                         intersect: false,
                 },
     hover: {
               mode: 'nearest',
               intersect: true
                 },
          scales: {
       xAxes: [{
         display: true,
         scaleLabel: {
           display: true,
           labelString: 'History'
         }
       }],
        yAxes: [{
             type: "linear",
         display: true,
         position: "left",
         id: "y-axis-eth",
     // grid line settings
         gridLines: {
           drawOnChartArea: false, // only want the grid lines for one axis to show up
         },
       }, {
         type: "linear",
         display: true,
         position: "right",
         id: "y-axis-eur",
       }],
     }
   }})
 updateChartData(pageSize,pageNumber);
});
Load data
The getJSON call (Jquery) connects to the Domino view. and gives 3 parameters :
- pagesize - set to 24 to retrieve the last 24 documents (there is a document generated every hour by the Python cron job)
- page number - set the paging - initially set to 0.
- systemcolums = 0 - avoids Domino specific data being returned (data that we’ll not use anyway in this scneario)
The JSON that is retrieved from the Domino view is now loaded into an array of objects, that we can loop through.
The Chart data is directly accessible :
- Labels :
myChart.data.labels - Dataset 1 :
myChart.data.datasets[0].data - Dataset 2 :
myChart.data.datasets[1].data
The last call , myChart.Update, updates the Chart and redraws the chart.
var updateChartData = function(ps,pn) {
 $.ajaxSetup({
       async:false,
     type: "GET",
 });
 myChart.options.title = {         display:true,
                 text: 'Last 24 hour performance - ' + $.format.date(Date.now(), "d MMM yyyy HH:mm")
             };
 $.getJSON("/dev/dataservices.nsf/api/data/collections/name/GraphData?systemcolumns=0&ps="+ps+"&page="+pn, function(data){
     console.log(" Loading page " + pn + " with pagesize " + ps + " returned " + data.length + " entries");;
     for (var i=0; i < data.length; i++) {
         //console.log( " index: " + i + " EUR : " + data[i].TOTAL_VALUE_IN_EUR );
         myChart.data.labels.unshift($.format.prettyDate(data[i].CREATED));
         myChart.data.datasets[0].data.unshift(data[i].TOTAL_VALUE_IN_EUR);
         myChart.data.datasets[1].data.unshift(data[i].TOTAL_ETH);
     }
     //shift to delete first element in arrays, not necessary in this case
     myChart.update();
  });
};
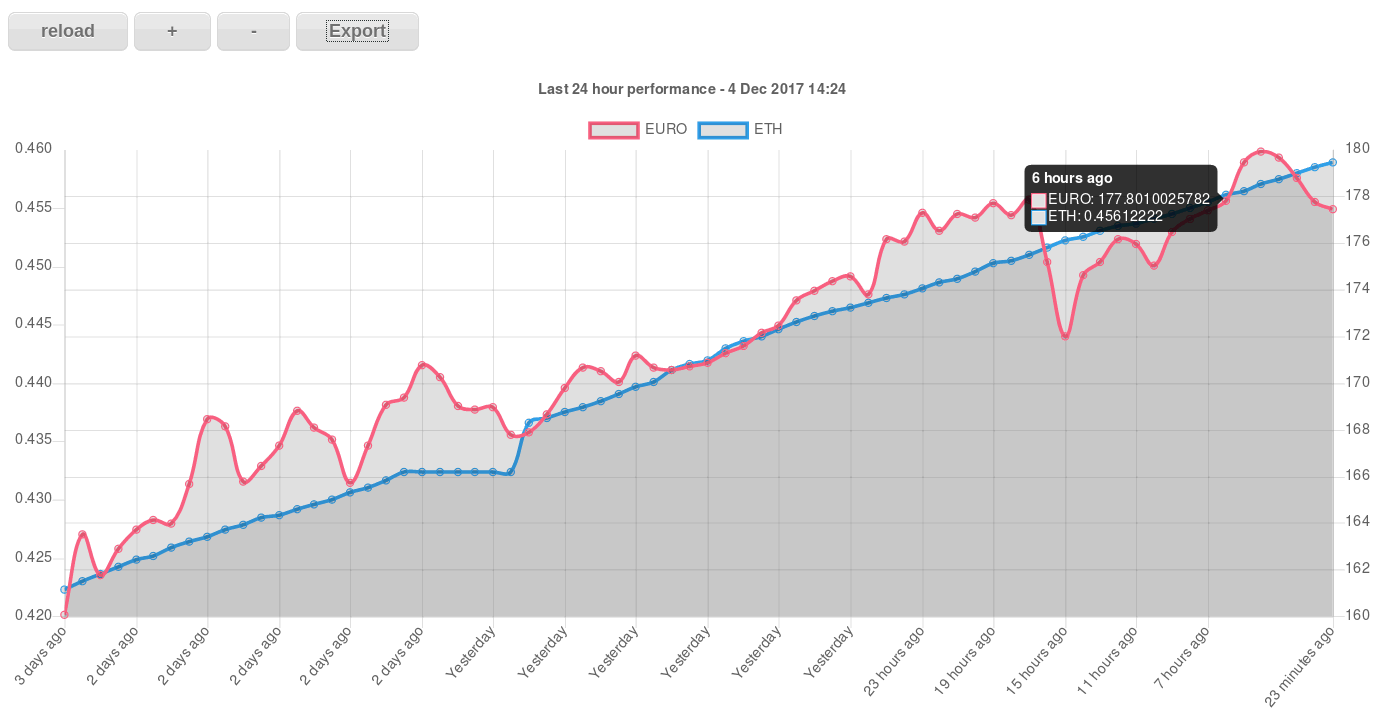
This is the end result :

Actions
To code the buttons, I used an EventListener (copied from the Chart.js samples : http://www.chartjs.org/samples/latest/charts/line/basic.html ). However , they did not work as expected initially.
On every click, the whole page reloaded - this is not what you want in a Single Page Application !
To counter that, I added the “e” in the function to pass the Event handler , and then use preventDefault, to avoid reloading of the page.
$( "#addData" ).click(function(e) { // --------- prevent page from reloading ------
 e.preventDefault();
 // ----
 pageNumber++;
 console.log( " Retrieving page : " + pageNumber );
 updateChartData(pageSize, pageNumber);
 document.getElementById('removeData').disabled = false;
 });
Without Jquery, it would look like this (it needs some additional code for cross browser compatibiiltiy).
The first line is there for cross-browser compatibiltiy (Firefox does not know window.event, that is actually an ugly IE hack).
document.getElementById('addData').addEventListener('click', function(e) {
  if(!e){ e = window.event; } ; e.preventDefault();
 pageNumber++;
 console.log( " Retrieving page : " + pageNumber );
 updateChartData(pageSize, pageNumber);
 document.getElementById('removeData').disabled = false;
 });
Only after I made that change, I realized that this behaviour was in fact caused by Domino, and that disabling the Database propery “Use Javascript when generating pages” would fix this.
Why our Domino developers ever thought it was a good idea to put HTML forms in Pages, I will never understand (I understand they used this in Forms).
And in my testing, I still needed the preventDefault, even with the Database property set …..
Some after the fact googling, suggests to me that using preventDefault is in fact the way to go (eg. https://xpagesandmore.blogspot.be/2015/06/bootstrap-js-modal-plugin-in-xpages.html ).
Lessons learned
-
Using a Domino Page to host the Javascript code, enables the Domino security model .
-
I forgot about the Domino quirks with regards to web applications (
e.preventDefault) -
$.getJSONcan be set up using$.ajaxSetup, although it’s not necessary. -
I didn’t find good Chart.js samples for dynamic loading of data.
Tips
Since we’re talking Ethereum, you may of course donate here :-)
bosmans.eth